Reporting is hands down one of the most terrifying parts of a marketer’s job. All our hard work, brilliant ideas, and nervous campaign executions are exposed, and we have to come to terms with the essential question that keeps us all employed… Did it work?
Marketers employ a strange version of the Scientific Method. Equal parts science and art, we gather as much data as we can, come up with a wacky new concept, and throw it all against the wall to see what sticks. We form good hypotheses and try bold new things. Lather. Rinse. Repeat.
It can be daunting to go through this process over and over, month after month, quarter after quarter. Having to look forward AND backward at the same time can be exhausting. Which is why we’re taking it down to the studs so maybe, just maybe, you don’t feel all that 4th quarter pressure this year.
You’re Reporting Renovation Begins:
Step One: Reporting Taxonomy
Go through all the reports that you pulled last quarter, and take a quick inventory of which of the following two categories each report fell into:
- The Success Report – This report has a start and end date, measures performance over a defined length of time, and clearly and cleanly answers one single question: Did we achieve the goal we set when we began this campaign?
- The Performance Report – This report measures campaigns that are currently in flight, and seeks to determine whether we are on track to meeting our previously stated goal.
This step is crucial. We need to understand the function behind each report so we know how to make sense of it. If we’re only ever compiling Performance Reports, we never get to step back and appreciate our successes or celebrate a really awesome quarter.
Conversely, if we only ever generate Success Reports, we are constantly blindsided by a campaign that we thought was going really well actually turning out to be a huge failure. Or we have a monster success of a campaign and we don’t really know why that happened and we could have capitalized on the momentum earlier.
Step Two: You Need A Goal
Notice that each of these above reports require a goal to be set first. A campaign-specific goal should have been defined at the onset of a campaign, a revenue-specific goal should have been defined at the beginning of the quarter or year, etc. Having a goal gives the report orientation and purpose, because it forms the question that the report is meant to answer.
No goal? Don’t bother pulling a report, because you won’t be able to make sense of it anyway. Sure, there are cases for running some numbers to establish a benchmark, but this is NOT the kind of report you want to send to your VP or executive team. Keep gut-check reports internal.
Note: If you are asked to generate a report without knowing what goal/question the report is to answer, don’t hesitate to ask! Avoid the trap of being held to numbers or expectations you aren’t aware of. You don’t want to be in a situation where you send a report with number you think are on target, only to be caught off guard when someone else disagrees.
Step Three: Interpret on Others’ Behalf
One of the worst things we can do is send off a report without any synthesis for the consumer of the report. You don’t want to leave any interpretation to chance, so make sure on each slide/report/graph you include a So What line, or a Summary statement that helps the report consumer make sense of what she is seeing, so that you are reaching similar conclusions together.
If your numbers are disappointing or otherwise hard to interpret, be honest about that, but make sure to provide some assurance going forward. By knowing that your AdWords campaign is performing terribly, you’re saving the company thousands in future wasted spend, and by seeing no pipeline created from a particular tradeshow, you now know that you can reallocate that spend toward doubling down on a high-performing show.
To summarize, provide some insights with your reports that help bring clarity to the message you want to get across. Which of the following will help your team attain a better glimpse into this month’s successes and shortcomings:
- No Insights: Hello team, below is this month’s email report. Please let me know if you have any questions.
- With Insights: As you can see with this month’s emails, the Best Practices content outperformed our average CTR by 42% (5.2% CTR). We may want to consider developing more of that content. For the third month in a row, The Monthly Bulletin unsubscribe rates continue to exceed all other communications. A further analysis is required.
Step Four: Build your Report Library
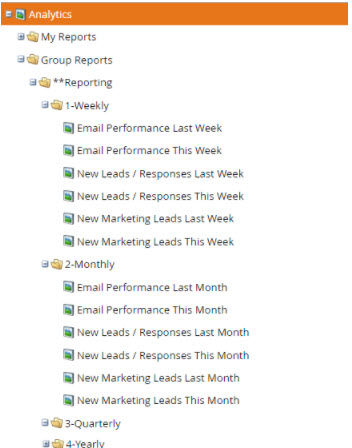 Marketo makes this so easy! Here is a common foldering structure I like to use in the Analytics section of Marketo where every folder here has the exact same report, just with a different date range.
By creating these reports once, validating them, and cloning them, you are making sure you have the exact same parameters for each. This allows you to compare period-over-period without worrying if the data for each is wrong. This also allows you to build Report Subscriptions so that your Last Month report gets sent to your inbox the first of every month, when the data is fresh and the most accurate.
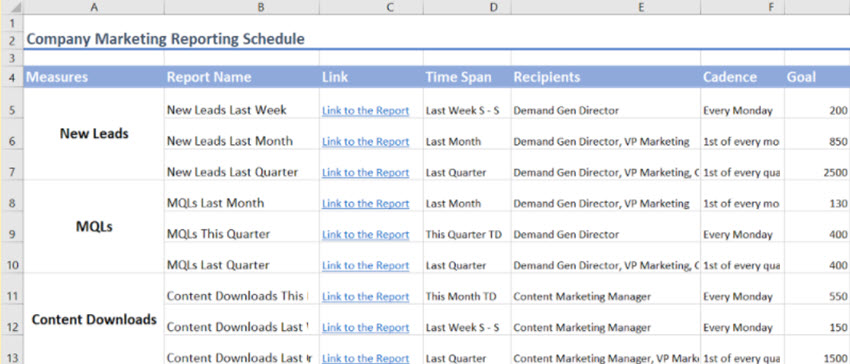
Step Five: “Who, What, and When” your Reporting Needs
Make a spreadsheet that keeps track of all the reporting your team is responsible for. Have columns that display WHO the report is to be sent to, WHAT the data is supposed to show, and WHEN the report should be sent each month/quarter/year.
This will not only help the team prioritize reporting with other timely needs that come up, but might help you combine reports or find new ways to connect your data. If you’re sending one report that measures new leads from social, and another that measures new leads from webinars, perhaps combine them into a New Leads by Lead Source report.
Summary
Defining your organization’s KPIs doesn’t have to resemble the rebuilding of a house. Use some of the above steps to help remodel what makes the most sense. Good luck remodeling and making the most out of the 4th quarter!
Previously published on the RevEngine Marketing site by Tyson Jurgens