
Wouldn’t you love to know what happens to all those leads flowing into and through your sales and marketing funnel? Yes, of course you would. So would the execs at your company, and your investors, and just about anyone who knows what a marketing funnel is. The geniuses at Marketo figured out that you can – and should thoroughly measure your lead funnel. And so, they invented the Revenue Cycle Modeler (now Lifecycle Modeler Application). Marketo LMA is one of those amazing product capabilities that immediately draws you in the moment you see it. How is it then that this product capability that’s so appealing and so necessary – is so misused or never-used by Marketo customers?
In this blog series I will explain what I’ve learned about RCM in the real world helping companies of all sizes get Marketo lifecycle models up and running, and more importantly designing them to run in a reliable and usable way. My learning came from many hours spent analyzing model data – which, by the way Marketo gives you plenty of when it comes to LMA. And that is part of the challenge: there is so much data being collected that it can be challenging to figure out how to make sense of it. In this first entry of this series on LMA, I’ll explain what it is and how Marketo packages the product today.
The Perfect Funnel
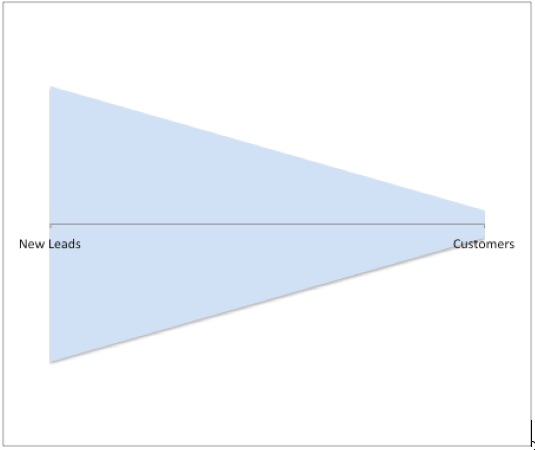
If we lived in a perfect world, every lead that’s created in Marketo would be associated with a closed/won deal at the moment they’re created. But the reality is quite different: some leads never become customers, and some do but in a time of their choosing. If you create 1,000 new leads, and 100 of them become customers, the flow from new lead-to-customer would look like this, where the ratio of new leads to customers is 10 to 1.
If you could count how many new leads were converted to customers and the elapsed time for any month, you could compare the conversion ratio and time-to-convert month by month. The conversion over six monthly periods might look something like this, averaging 6.53% across the period.
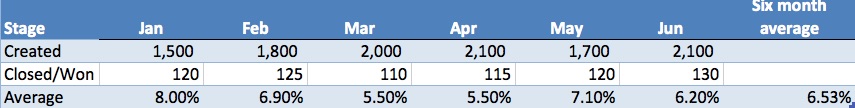
And if you assume 6.53% of the new leads you create will become customers, you can estimate how many leads would be required to produce 200 customers by dividing 200 by 6.53% to get 3,061. That’s one example of how measuring lead flow can help you plan your programs to drive new leads into the top of the funnel by using historical averages as a basis for plans aimed at achieving a new customer goal. So far I have described using two stages to define a funnel: new leads and customers. But consider that a typical model could have ten stages, and a company could require two or more separate funnels to measure lead flow in two distinct businesses – things can get a very complicated very quickly. You would need an easy way to collect and analyze all data across twenty stages in that example. Yes, you could create a bunch of custom fields to stamp the date every time a lead passed through a funnel stage but who’s got time to create the logic for that, let alone analyze it? Enter Marketo RCM. RCM takes care of all the data collection required to thoroughly measure a funnel – velocity, volume and conversion metrics — from stage to stage.
Visual Modeling: Deceptively Simple
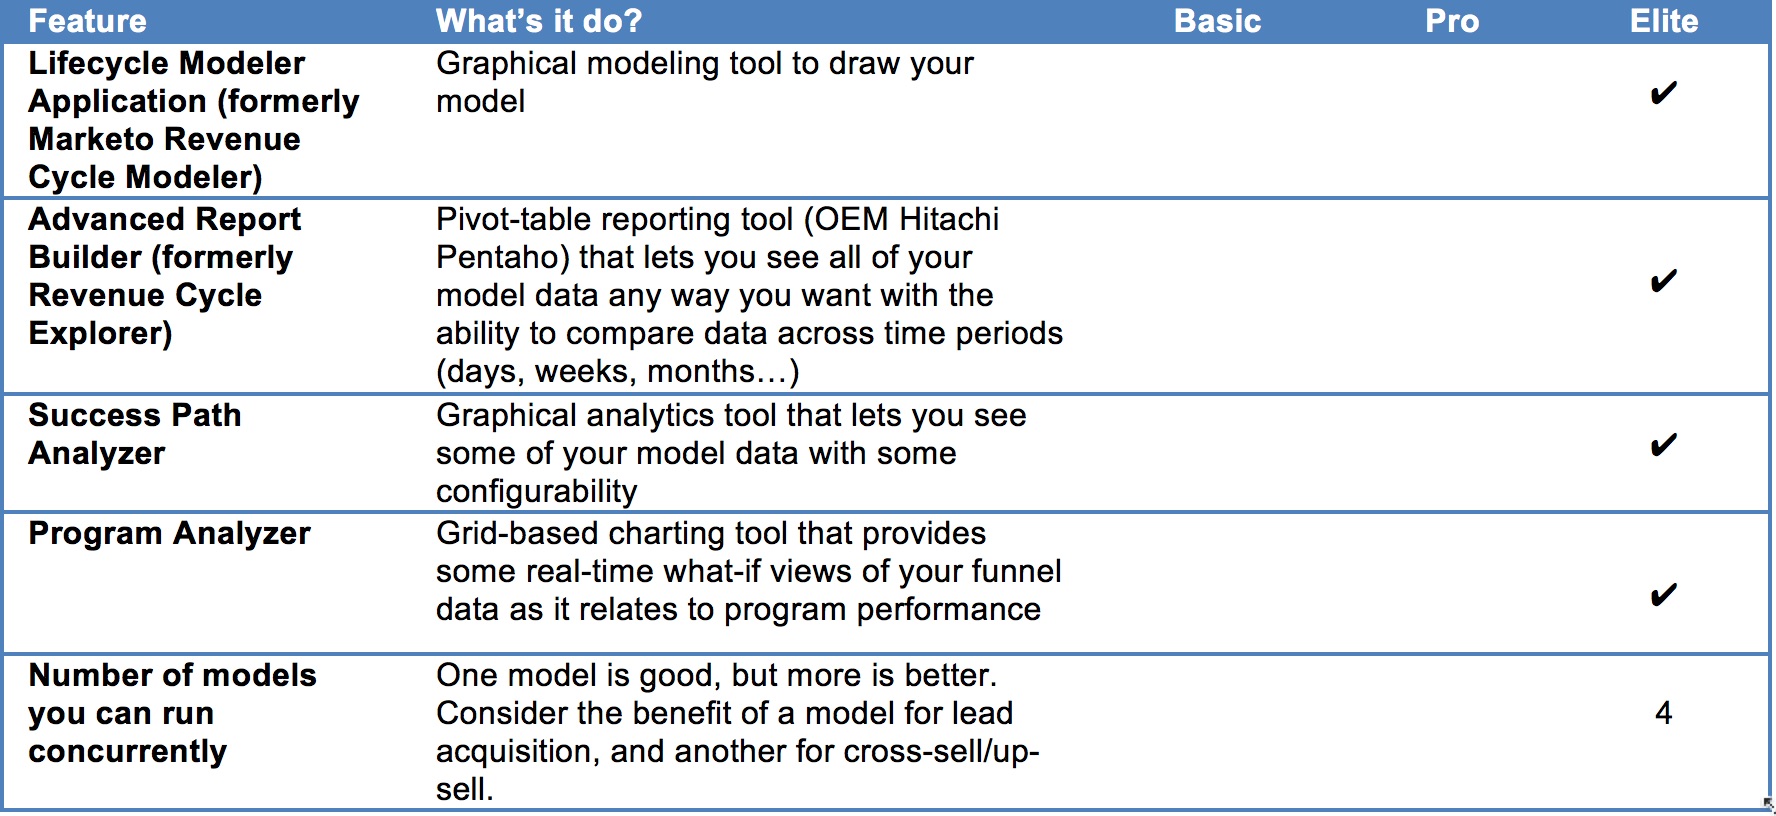
Marketo made it really easy to drag and drop your way to a lead lifecycle model using a simple graphical user interface. You create a new model, add the stages you want, connect them together with lines, tell the model what conditions to look for to move a lead from one stage to another, and save/approve it. Sound easy? It is, but this wouldn’t be a blog series if that’s all there was to it. The original vision for the graphical modeling designer was to contain all of the logic (triggers) to move leads through the funnel embedded in the model. It turns out that if you really want your model to run right, and control non-model events such as date stamping fields for reporting in your CRM, you’re better off separating the logic that drives leads through your funnel from the graphical model, building the logic instead in the form of smart campaigns and a program dedicated to driving lead flows. Here are all the Marketo product parts and packaging you need to know about Enterprise packaging unbundles reporting, so you buy what you need. Note that Marketo’s new packaging does not impact current customers using Spark, Select and Standard Editions; Spark has no modeling tools, Standard supports one model but you don’t get RCE, Select supports two models and includes RCE. In order to do any modeling in non-Enterprise versions, you must purchase the Elite edition. Here are the new Marketo editions packaging for modeling and reporting:
Now you know enough to have an intelligent conversation about Marketo analytics. But we only scratched the surface; what lies beneath are the truths about what it takes to get a model running right. Check back next week for Part 2 of the model funnel series.